U.S. unconventional drilling stalls in 2019 while completion is expected to increase 4% in 2019
With E&P’s showing an increased level of commitment to generate higher returns for their investors through capital disciplines, onshore US drilling and completion activity will likely remain stagnant in 2H 2019 in a $60/WTI base case oil price scenario – based on a consensus among 25 investment and financial institutions.

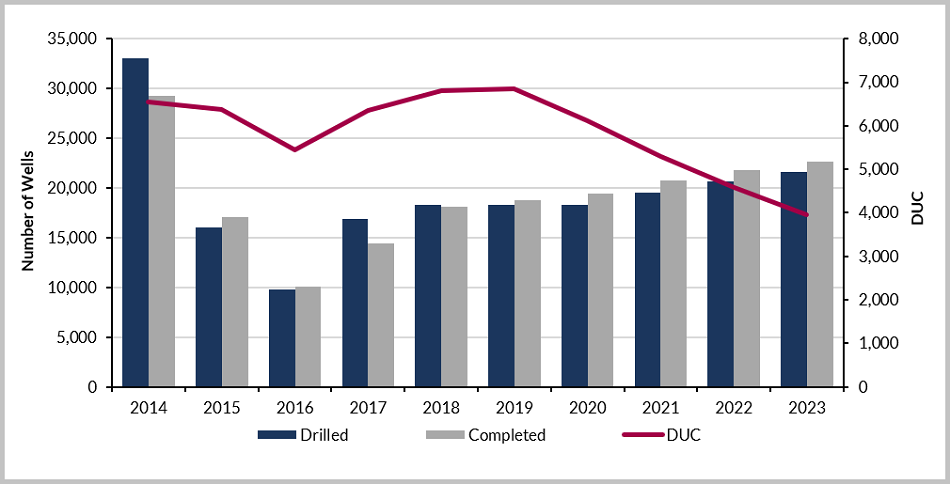
US L48 D&C Outlook 2014-2023 Summary. Westwood expects the DUC inventory to decrease, especially once Permian price differentials subside with the commissioning of new pipelines. The Permian basin currently has the most DUC’s at 2,600.
Source: Westwood data and analysis
New in this report:
- (Multi-Well Pad Drilling Trend) Multi-well pad drilling is continuing to rise in the US unconventional basins. The DJ-Niobrara, Williston and Eagle Ford are currently at above 90% adoption rate. The 50% adoption line was reached in Q4 2017 by all basins.
- (Total Footage Drilled) While total number of horizontal wells drilled in 2018 is almost 25% lower than 2014, the total footage drilled is nearly the same, indicating the magnitude of growth of lateral length in recent years. Vertical and deviated wells have dropped sharply since the 2014 oil price downturn, currently at 10 million feet across the eight basins.
- (SatScout Analysis) Satellite-driven analytic service by Westwood reveals that oil majors took longer to frac their wells from the point of pad constructions. The median pad-to-frac cycle time for majors was 264 days for wells frac’ed during Q1 2019.
Main Audience:
- Investment banks, private equities and original equipment manufacturers that need to assess macro-level risks on a national or regional basis in the next five years
- Oil and gas operators and oilfield service companies that need to gauge national or regional market size, activity trends for metrics of their interest
- Types of Roles: Strategy, Competitor Intelligence & Commercial teams, Marketing and Business Development teams, Supply chain teams, E&P Asset teams, Financial Analysts
US Drilling and Completion Outlook analyses use Energent’s proprietary database which includes well data from 1,900,000+ US wells with well completion and frac details including lateral length, proppant per foot, stage count, max pressure, average rate, horsepower demand, and more.
Q1 2019 databook is also available upon request (Cautionary note: Q2 industry investor reports market view was not yet available at the time of Q1 databook modeling).
Disclaimer
This report has been prepared by Westwood Global Energy Group and all rights, whether pertaining to the body of this report or any information contained within it, are reserved. This report is confidential and must not be made available by you to any other person. The information contained in this report is intended for the sole use and benefit of clients of Westwood Global Energy Limited who subscribe to services permitting access to this report.
This report is based on Westwood Global Energy Group’s experience, knowledge, and databases as well as publicly available sources. No representation or warranty, whether express or implied, is made by Westwood Global Energy Group as to the fairness, accuracy or completeness of any information (whether fact or opinion) contained in this report. The information included in this report is subject to change and we do not undertake to advise you of any changes to such information. The report does not constitute (i) an offer or recommendation to buy or sell any securities; or (ii) investment, financial, legal, tax or technical advice. Westwood Global Energy Group does not accept liability in respect of any actions taken or not taken based on any or all of the information contained in this report, to the fullest extent permitted by law. Do not act upon the information contained in this report without undertaking independent investigations and assessments.


