Report Summary
Westwood has investigated success rates for exploration wells which targeted the five direct hydrocarbon indicators (DHIs) most commonly reported by companies pre-drill; Flat Spot, Amplitude Anomaly, Amplitude vs Offset (AVO) Anomaly, Amplitude Conformance and Electro Magnetic (EM) Anomaly. The DHI dataset covers 536 prospects with publicly reported pre-drill DHI support drilled between 2008 and 2019 (end Q3) across a range of play maturities from frontier to mature, in 95 basins globally.
Prospects with DHIs had a higher than average technical success rate (TSR) over the ~12 year period, however, only Flat Spots, had a higher commercial success rate (CSR) (39%) than the benchmark average (30%). Prospects with other DHIs (Amplitude, AVO, Amplitude Conformance, & EM) were found to have below benchmark commercial success rates. DHIs worked well for de–risking the presence of hydrocarbons but were generally less reliable in improving the chance of commercial success.

The presence of a DHI was most likely to lead to a gas discovery with 71% of discoveries with reported DHIs encountering gas, gas condensate or gas and oil. 86% of discoveries with flat spots were gas rich.
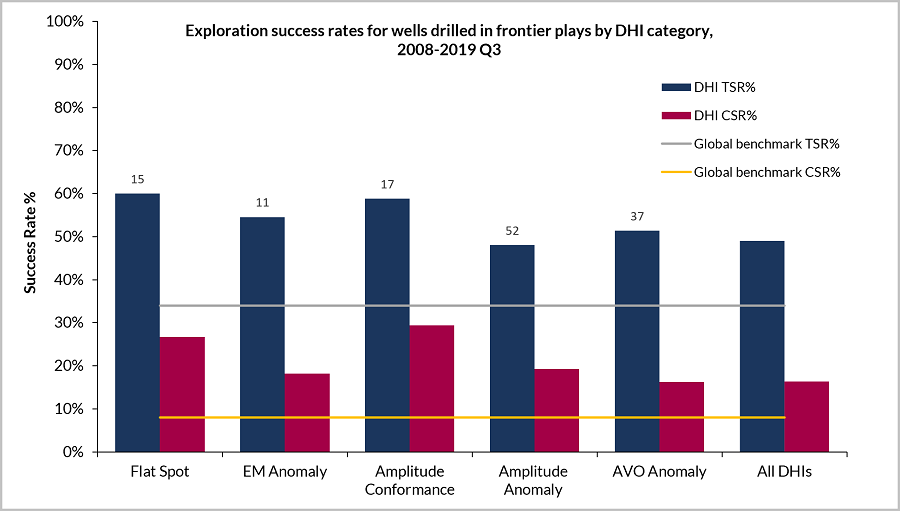
DHIs were found to be most effective in frontier and emerging plays. The TSR and CSR for frontier wells targeting DHIs were 49% and 16% respectively, both substantially higher than the benchmark TSR and CSR for all frontier play tests of 34% of 8%.
In maturing and mature plays, prospects with reported DHIs had TSRs three percentage points above the benchmark average at 58%, whilst the average CSR was six percentage points lower than the benchmark at 28%. Mature play DHI success rates globally were brought down by the mature plays of UK, Norway and Australia where success rates were particularly poor.
AVO supported prospects performed below the benchmark average for both TSR and CSR over the entire period highlighting a potential systemic misuse of AVO’s as an exploration tool.
Commercial success rates for wells targeting all non-specific DHIs have shown a marked improvement in the last five-year period increasing from a low of 16% in 2013 to 45% in 2019. In the period 2015 to 2019 Q3, CSRs for DHI wells averaged 34%, in line with the global benchmark. This improved performance is driven mainly by improved CSRs in wells targeting DHI supported stratigraphic trap prospects. The industry seems to have reduced the number of false positives and learned that combining consistently well-conditioned seismic data with sound geological models is the key to applying DHIs effectively.
Contents
1. Introduction & Dataset
2. 12-year performance of different types of DHI
2.1 All DHI supported wells 2008-3Q 2019
2.2 Wells with single DHIs versus multiple DHIs
2.3 High Impact wells supported by DHIs
3. DHI success rates by exploration context
3.1 DHI Performance by play maturity
3.2 DHI performance by reservoir age
3.3 DHI success rates by basin
3.4 DHI success rates by trap type (all play maturities)
Stratigraphic Traps
Combination Traps
Faulted Traps
4-way dip Traps
4. DHIs and hydrocarbon phase
5. DHI performance over time
6. Discussion
7. Conclusions
For further information on the DHI Exploration Performance report, please use the form below or contact [email protected]


