The analysis below is based on the financial and operational performance of 25 mid- to large-cap E&P companies between 2014 and 2017. Key findings are as follows:
- Unit costs are no longer falling – unit costs increased by 2% in 2017 having decreased in 2015 and 2016
- The Brent oil breakeven oil price is below US$45/bbl – falling marginally in 2017 to a weighted average US$44.8/bbl, down from US$62/bbl in 2014
- Net debt falls and operating cashflow jumps – net debt decreased by 9% and EBITDAX jumped by 46% with the end-year overall net debt/EBITDAX ratio falling from 2.7 in 2016 to 1.7 in 2017

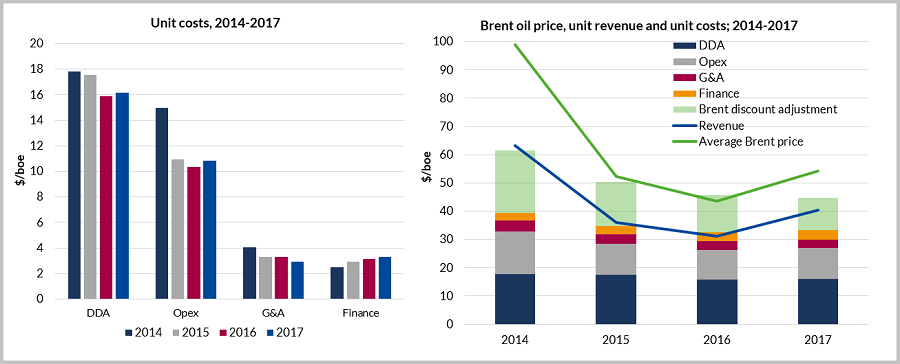
 Table: Aggregate production and US$/boe metrics for the 25 companies. Figure left: Unit DDA, Opex, G&A and Finance cost values. Figure right: Unit cost base for DDA, Opex, G&A and Finance, realised revenue per boe, average Brent oil price and the Brent discount breakeven adjustment.
Analysis of the annual reports of 25 mid and large cap E&P companies shows that the weighted average unit cost base (comprising DD&A, Opex, G&A, and Finance costs) fell from US$39.4/boe in 2014 to US$32.6/boe in 2016, but then increased 2% to US$33.2/boe in 2017. After a marked decrease from 2014 to 2015, the overall Opex/boe increased 2% to US$10.8/boe in 2017. Development costs (as measured by DD&A charges) rose slightly in 2017 to US$16.1/boe after falling from US$17.6/boe 2015 to US$15.9/boe in 2016 on the back of write-offs totaling some US$24.8bn in 2015. Total write-offs made by the 25 companies over the four-year period amount to US$47.3bn.
Finance unit costs increased in 2017 relative to 2016, with only G&A costs continuing to decline. In 2017, the 25 companies spent more on financing their debt (US$3.3/boe) than on G&A costs (US$2.9/boe). However, both remained below the expensed exploration costs – these are not included in the unit cost base for the producing assets – which added an additional US$4.2/boe in 2017, down from US$7.0/boe in 2014 on the back of lower drilling activity.
The combined effect of the cost base reduction since 2014 and a reduction in the realised revenue discount to Brent has meant that the Brent price at which the 25 companies would breakeven on a pre-tax net income basis has fallen by nearly US$17/bbl (-27%) from US$61.5/bbl in 2014 to US$44.8/bbl in 2017.
Cash generation has improved dramatically, up 46% in 2017 compared to 2016. Overall the 25 companies generated an EBITDAX of US$30.6bn in 2017 (US$21.0bn, 2016) and had an end-2017 net debt position of US$51.3bn (US$56.5bn, 2016), giving a combined net debt/EBITDAX metric of 1.7 (2.7, 2016). The companies that reduced their net debt/EBITDAX ratios the most in 2017 included Kosmos and Tullow, both helped by the ramp-up of the TEN oil fields offshore Ghana. Only two of the companies – Woodside and Canacol – saw their net debt/EBITDAX ratios increase in 2017.
The trends observed are consistent with Westwood’s previous analysis that a) unit operating cost reductions appeared to be diminishing with further cost savings unlikely; and b) that reductions in non-cash unit DD&A charges achieved to date have been largely due to write-downs of historic investments. Longer term cost savings from lower development costs will only become evident in subsequent years, once more of the projects sanctioned at the time of low oil prices have come onstream.
E&P companies have cut costs as much as they can, have stabilized financially and can now make a profit at above US$45 per barrel from their producing assets. Proving they can grow production whilst retaining cost discipline is the next challenge.
This is an extract from a longer article published in the March 2018 Wildcat Corporate Monthly Report.
Robert Stevens, Analyst, Global E&A Research
[email protected] or +44 (0)20 3794 5378


