How does Energent methodology compare to that of EIA?
To many analysts and investors who monitor energy sector, drilled-but-uncompleted well (DUC’s) counts are an important metric along with CAPEX plans, acreage grades, and regional risk factors that might affect the production level in the near-term. As E&P’s increasingly focus on optimizing field development through multi-well pad drilling in a factory style[1], it is important to understand how this phenomenon could impact the DUC’s going forward. Energent’s undertaking begins with a well-by-well assessment of DUC counts in the major unconventional basins.
As comparison, U.S. Energy Information Administration (EIA) estimates DUC’s for Lower 48 since December 2013. EIA’s methodology relies on a dataset that only represents partial horizontal completion activity, since EIA uses FracFocus filings for completion activity calculations. However, some states are either not requiring operators to file completion activity to FracFocus, or only recently enacted the policy requiring operators to submit their completion reports to FracFocus (e.g. New Mexico). Also, albeit small population, we cannot safely dismiss the possibility of non-compliance from some small, private operators.
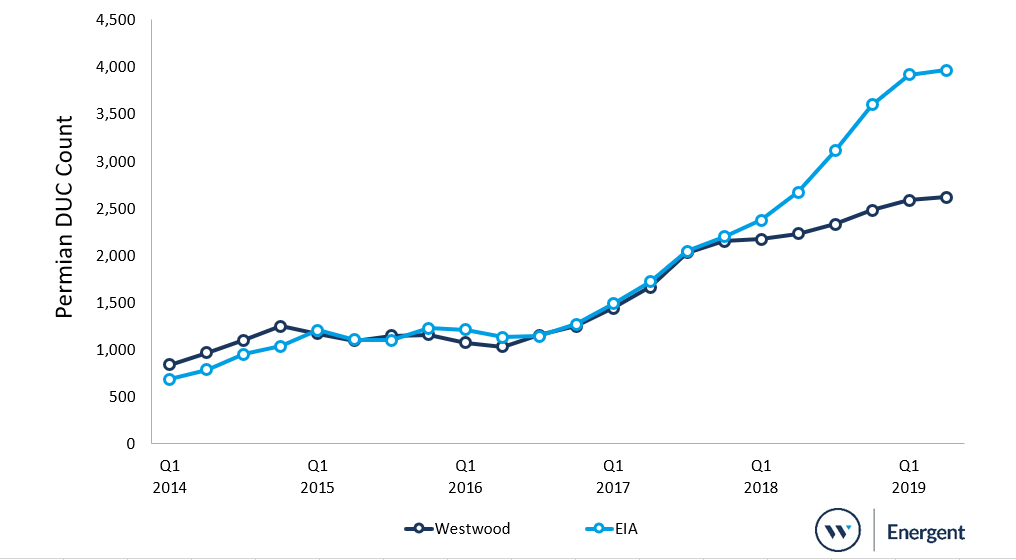
 Figure 1: EIA and Energent Permian DUC comparison Source: EIA, Energent data and analysis
A weak completion count would naturally inflate EIA’s DUC counts as shown in Figure 1. This flaw is only exacerbated by the fact that the state of New Mexico, which is a part of the most active basin among the unconventional plays in L48, did not require operators to submit their hydraulic fracturing records to FracFocus until last year, even though the reports are available on the state website. As government regulations take some time to be fully implemented, unaccounted completion activity from Lea and Eddy counties of New Mexico alone would increase DUC’s in the Permian in the EIA’s estimates.
Energent’s data suggests about 15% of total wells completed in 2018 do not show up on FracFocus data. EIA regularly updates previously reported estimates once more public data becomes available and, as a result, there is little discrepancy between the two estimates after one-year time window.
The table below shows key categories for the methodology.

Table 1: Comparison of EIA and Energent DUC Methodology
Source: EIA, FracFocus, and Energent
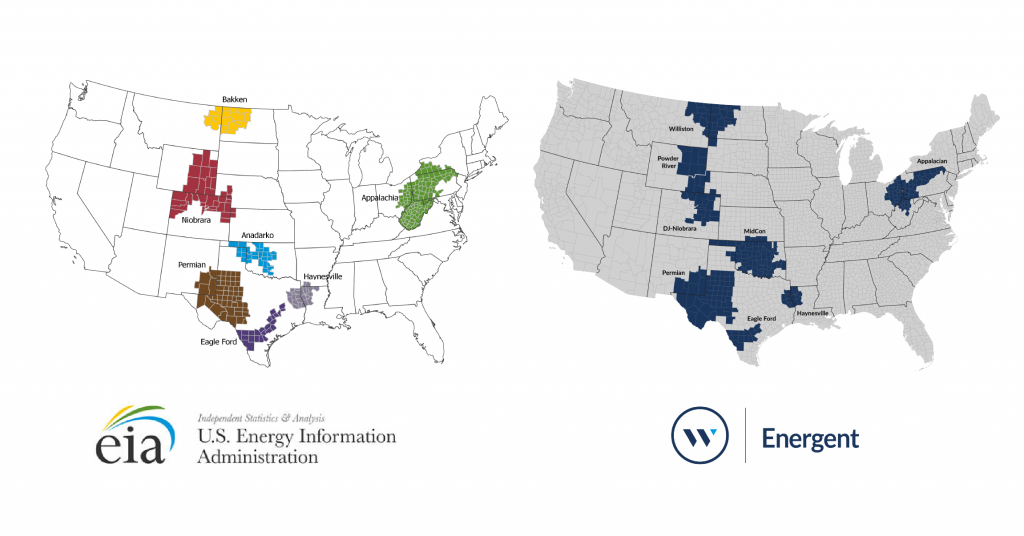
Energent uses a more direct approach in which we scrape all publicly available data from the states included in our basin definition and create a unified version named Energent Well Index in order to analyze US drilling and completion activity. EIA, on the other hand, has developed a model which relies on a set of third-party data as described in Table 1. For the spud counts, EIA’s method derives similar outputs as Energent’s. In doing so, EIA uses what they call a rig productivity factor. While there is a difference in the way EIA and Energent recognize the timing of spud activity (spud end vs. spud start), it should not affect the overall numbers unless there is a dramatic month-over-month change.

Figure 2: EIA and Energent Basin Definitions
Source: EIA and Energent data and analysis
All other clean-up processes ensuring the quality of data are the same for both EIA and Energent. For instance, all permanently abandoned DUC’s and non-oil and gas wells such as disposal or miscellaneous wells are excluded from the calculations.
Energent data suggests that post-downturn (Q4 2017 – now) accumulation of Permian DUC’s were not only entirely generated by multi-well pads which consist of between 2 and 4 wells but there was also a sharp drawdown of DUC’s from single-well pads totaling nearly 200. This could suggest tightening capital market for smaller E&P’s that mostly drill vertical and deviated wells.
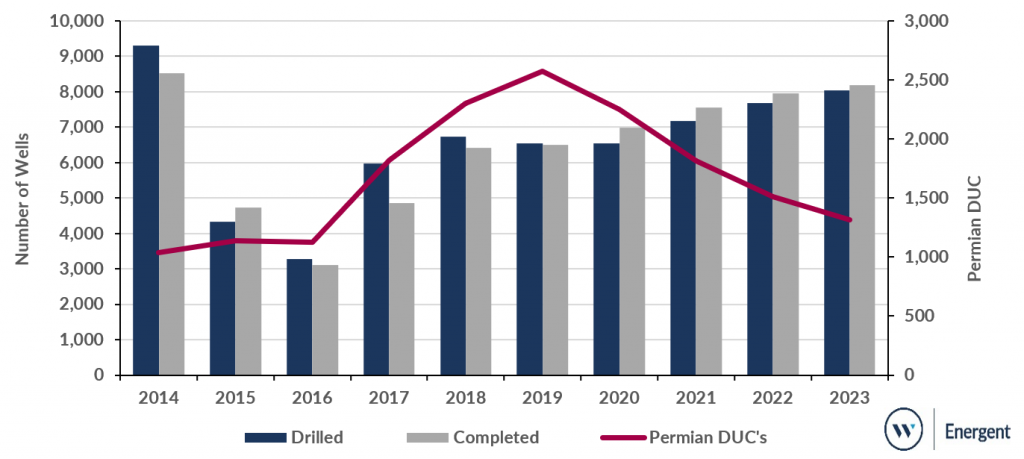
Assuming a $60/WTI base case oil price scenario[2] and continuing adoption of multi-well pad drilling by more operators, Energent expects the DUC inventory to decrease going forward, especially once Permian price differentials subside with the commissioning of new pipelines.

Figure 3: Permian D&C Outlook 2014-2023 Summary
The Permian basin currently has the mos DUC’s at 2,600.
Source: Energent data and analysis
Abbreviations
BHI – GE Baker Hughes
DUC – Drilled-but-Uncompleted wells
DPR – Drilling Productivity Report (by EIA)
D&C – Drilling and Completion
EIA – U.S. Energy Information Administration
* FracFocus is the national hydraulic fracturing chemical registry managed by the Ground Water Protection Council and Interstate Oil and Gas Compact Commission. FracFocus was founded to create a public database for reported chemicals used in hydraulic fracturing operations.
[1] Some companies call it a manufacturing mode. [2] Based on a consensus among 25 investment and financial institutions.


